Chapter 6: Javascript: Debugging
CS 80: Internet Programming
Instructor: Mark Edmonds
Developer Tools
- No program is perfect at first
- We need a way to examine program state as the program
is running
- This will enable us to understand and fix problems in our code
- Debugging will help fix any error, but it's
particularly good for identifying edge cases you may have
not considered when writing your program
- Common edge cases: empty string
"", zero0, negative numbers, etc
- Common edge cases: empty string
Developer Tools
- The debugger is present in any modern browser and has two main elements for javascript: console and debugger
-
Since we are editing the program as it
executes, we need to remember where we are in
execution
- Variables may not exist yet
- How to write information to the console to inspect
state:
- Use a
console.log()statement in your javascript - The value/text arguments will be printed to the Console section of the Developer Tools
- Use a
Breakpoints
- Setting a breakpoint
- Breakpoints say "when you hit this line of code, pause the program for me"
- They allow you to inspect variable/program state during execution
- Enable a breakpoint by clicking the line number
- Important semantic note: The line of the
breakpoint has not executed yet. It
is about to execute
- E.g. if we set a breakpoint on line 9, line 9 hasn't executed when the breakpoint triggers (line 8 has, however)
- Keep this in mind!
Breakpoints
- Stepping through a program
- Once we are at a breakpoint we have multiple
options to control the program:
- Step Over: step over the current line of code. This means if we are at a function call, do not move the debugger into the function. Instead, the function will execute, and the program will pause after function completes
- Step Into: If the program is about to call a function, move the debugger into that function and pause execution
- Step Out: Finish the current function call and pause execution at the calling function
- Continue: Continue the program's execution; basically unpauses the program
- Once we are at a breakpoint we have multiple
options to control the program:
Console Execution
- We can also call functions or inspect variables while
paused using the console
- Move to the console, and type a javascript
statement to execute
- Can also just type variable names to get their value
- If the javascript statement we called doesn't
have a return value (e.g. statement doesn't
yield a value), then the console will report
undefined.
- Move to the console, and type a javascript
statement to execute
Example
- Each browser has a slightly different interface, but the developer tools work the same way for all
- Let’s examine the developer tools within Chrome, but this will mostly work the same for every browser
- We’ll use
leap_year_checker.htmlfor the example
Opening Developer Tools
- First, open the HTML file you wish to debug. Here,
we’ll open
leap_year_checker.htmlin chrome - Open the Developer Tools and go to the “Sources” tab:
Opening Developer Tools
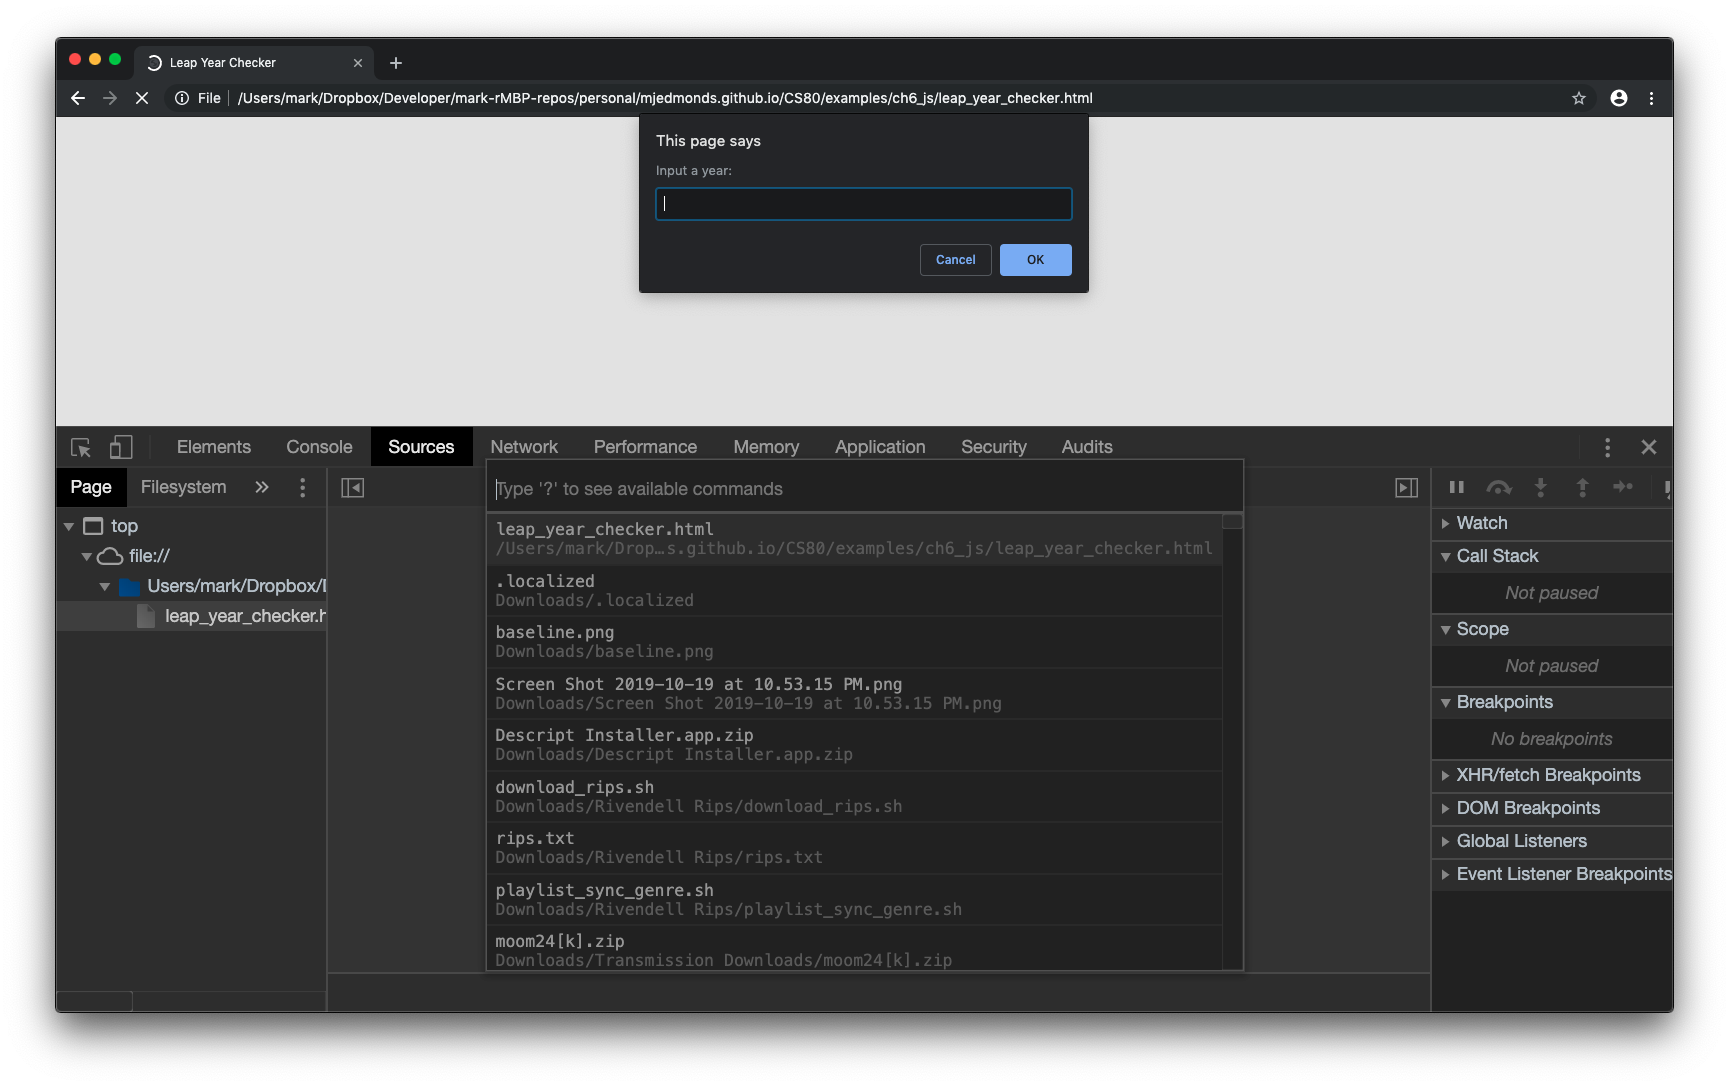
Opening a file
- Next, we’ll press cmd+p (or ctrl+p) to open a file
- If your
.htmlfile does not appear, refresh the page and try again:
Opening a file
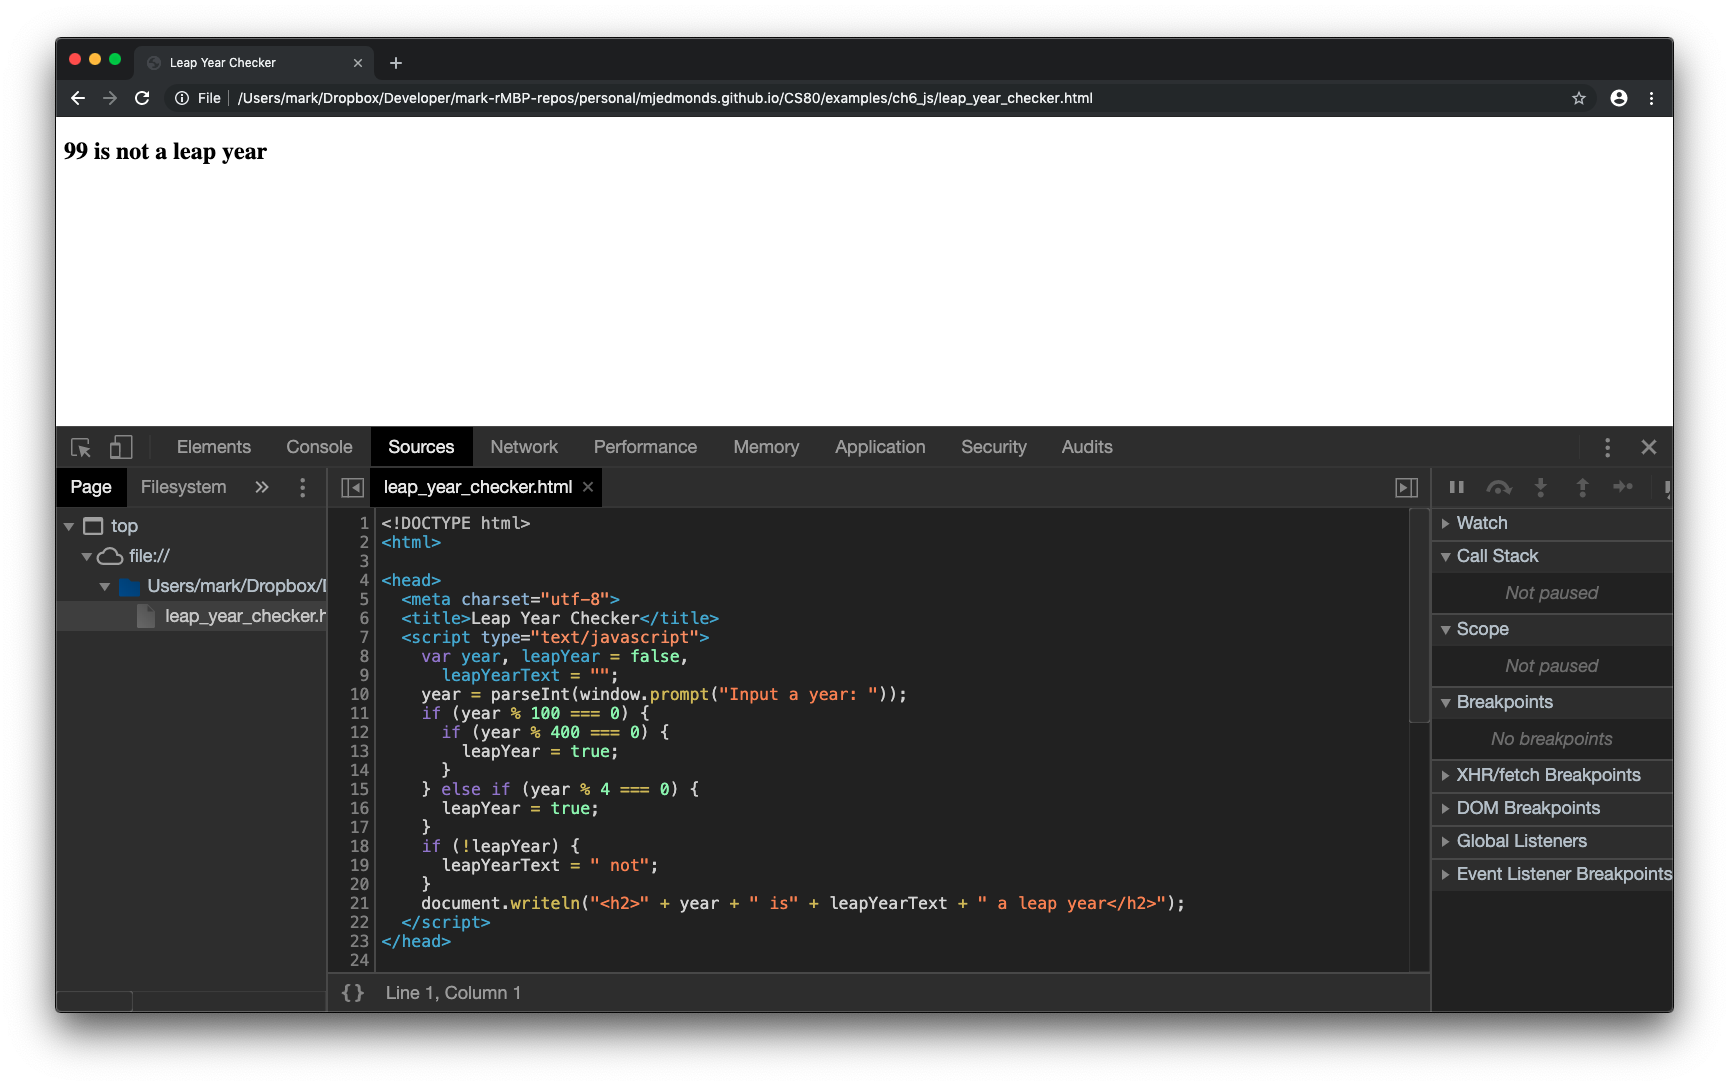
Opening a file
- Now, we should see our file loaded
- You will need to enter into the prompt to see the file in the area below:
Opening a file
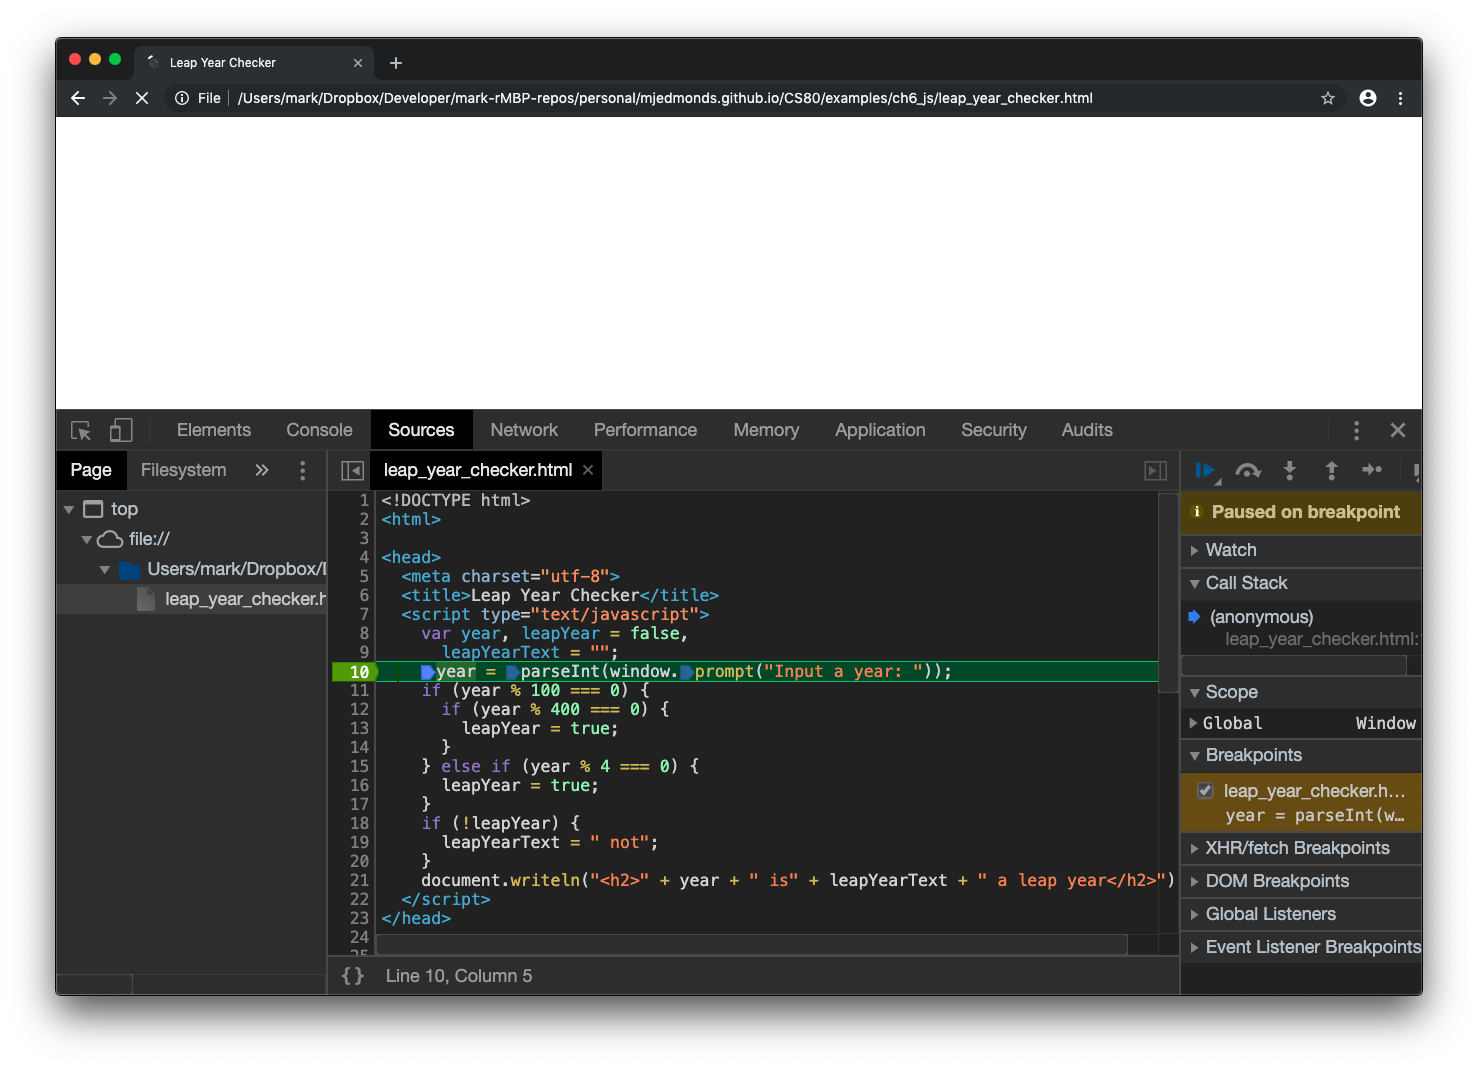
Setting a breakpoint
- Next, we’ll set a breakpoint on line 10 by clicking on the line (the green marker indicates a breakpoint):
Setting a breakpoint
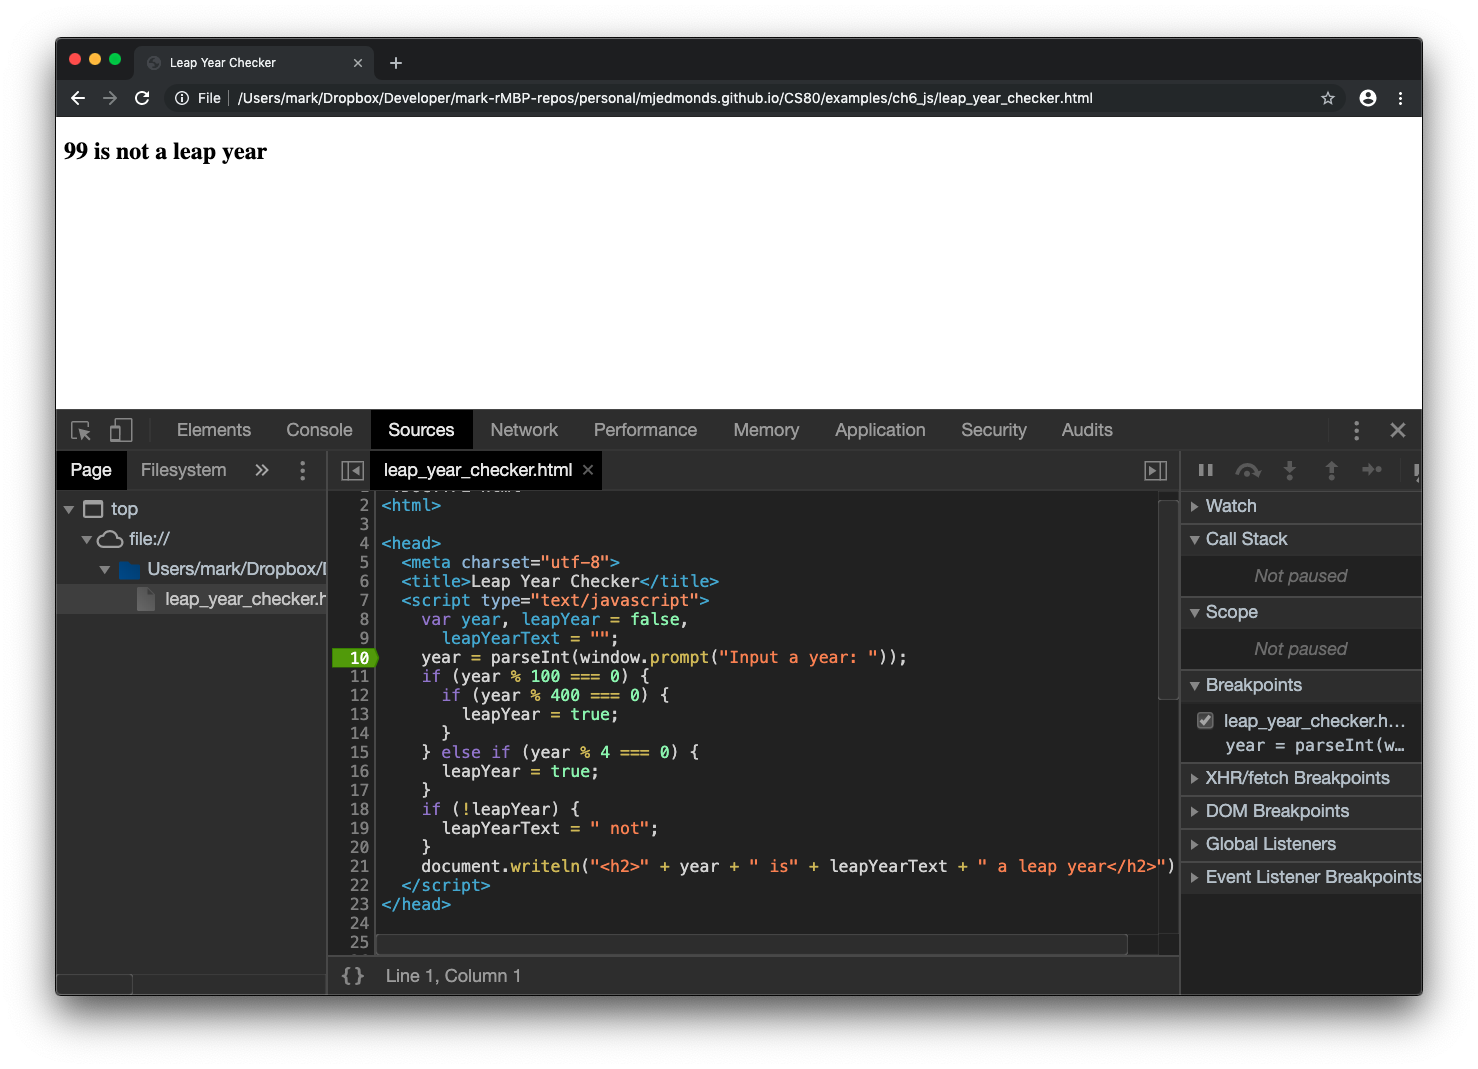
Pausing at a breakpoint
- Refresh the page. Now the page should be paused, before the prompt appears
- Note that since we paused at line 10, line 10 is about to execute, but has not executed:
Pausing at a breakpoint
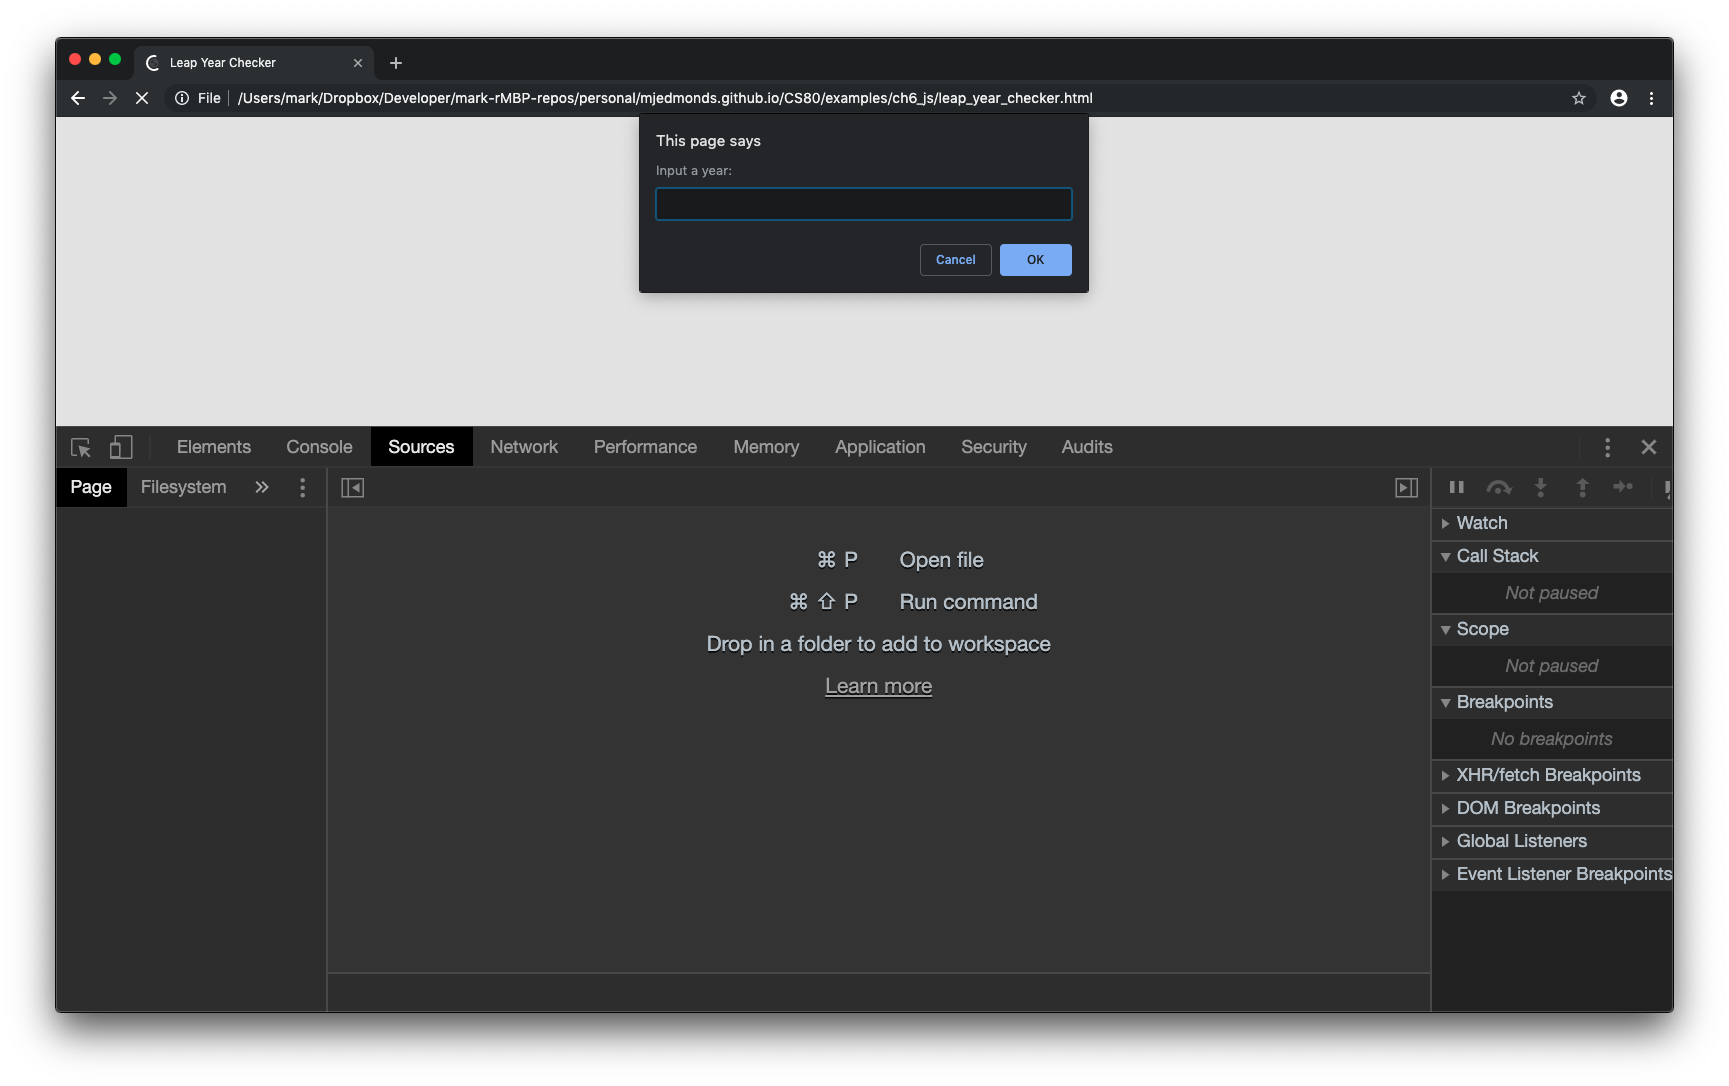
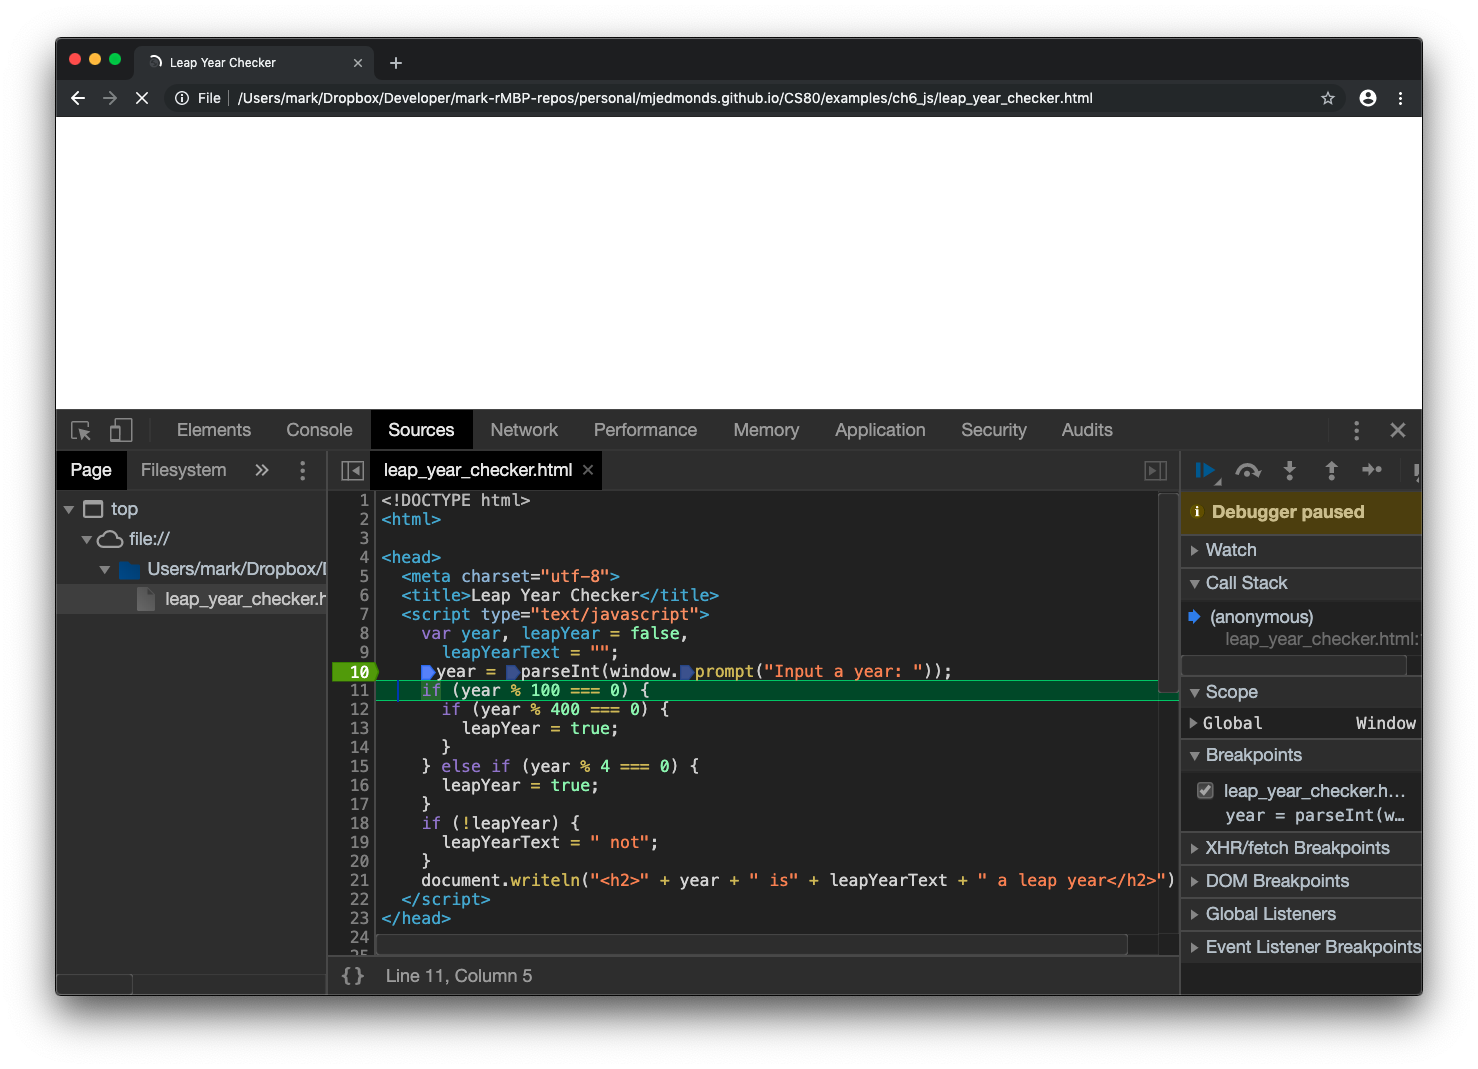
Stepping over
- Next, hit the Step Over icon (above the yellow “Debugger paused”; arrow hopping over a dot)
- The prompt will appear. Enter 99 and hit OK. We should now be paused at the next line:
Stepping over
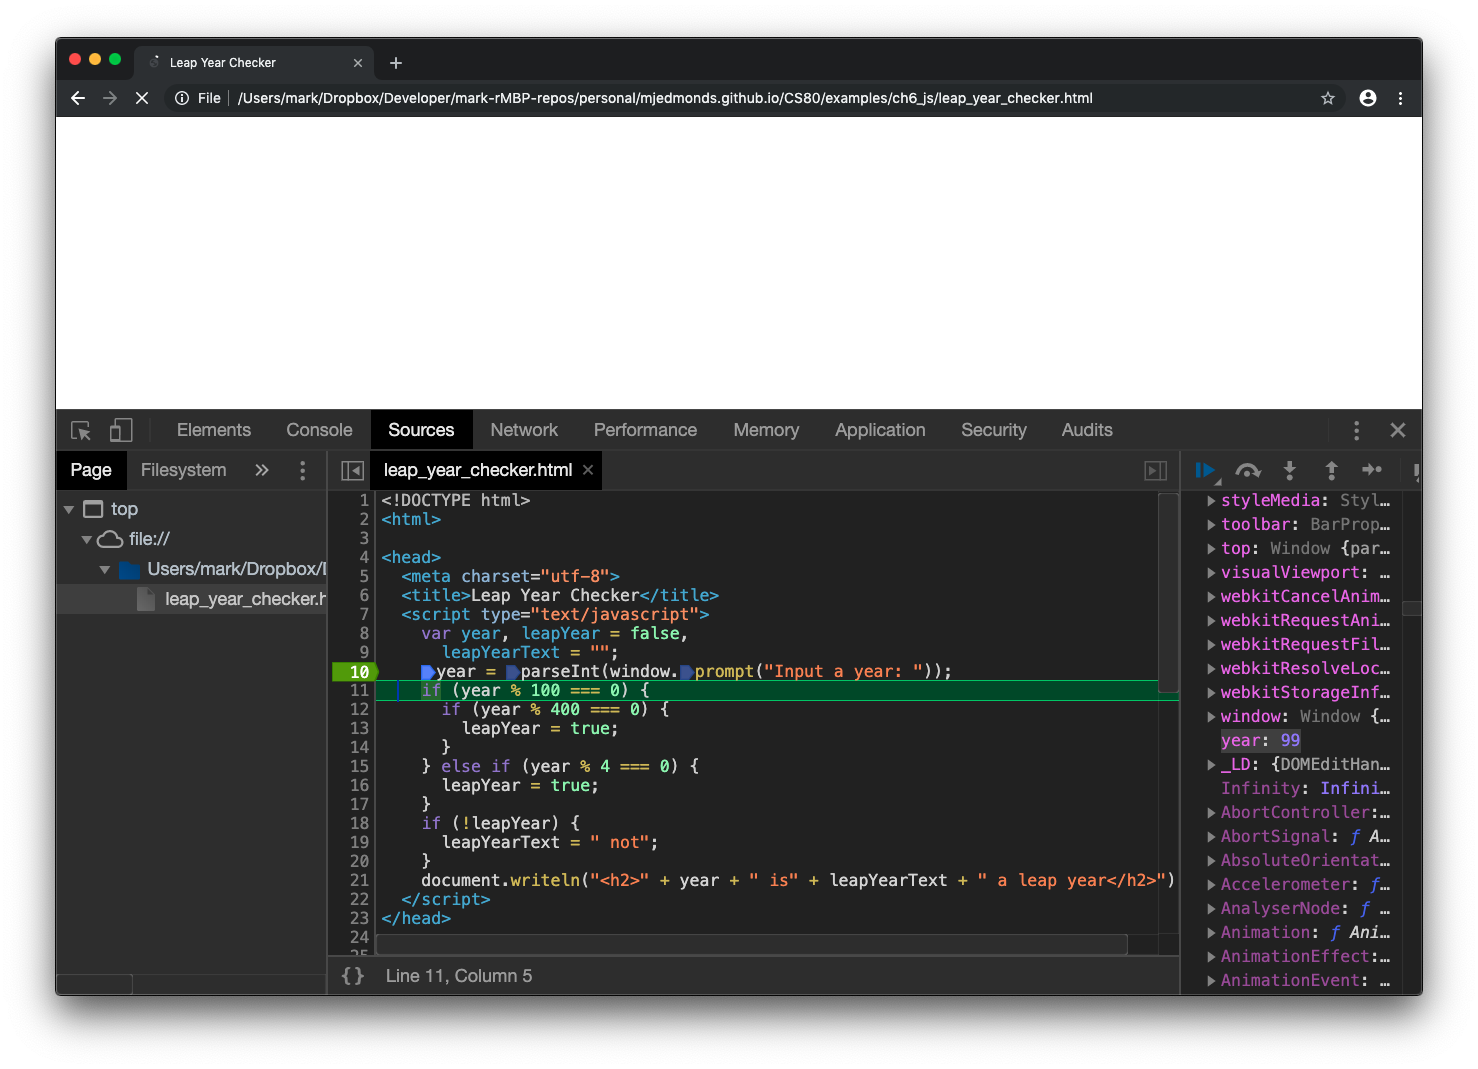
Checking variables
- Click the arrow next to Global under Scope on the rightside panel.
- Scroll down until you see the variable “year”
- Notice this variable has the value 99, which is what we inputted into the prompt:
- We can check and verify variables as our program runs, so we can spot incorrect results as we execute
Checking variables
Leap year example
- Continue to Step Over or press Continue (play button) until your program finishes.
- For this example, I would recommend inputting different types of leap years (2000, 1996, 1975, etc) to see how the control flow of your program changes with different inputs.
Additional resources
- Here are a couple of external introductions that may also be useful:
- Chrome introduction: https://developers.google.com/web/tools/chrome-devtools/javascript
- Firefox introduction: https://developer.mozilla.org/en-US/docs/Tools/Debugger